#image_title
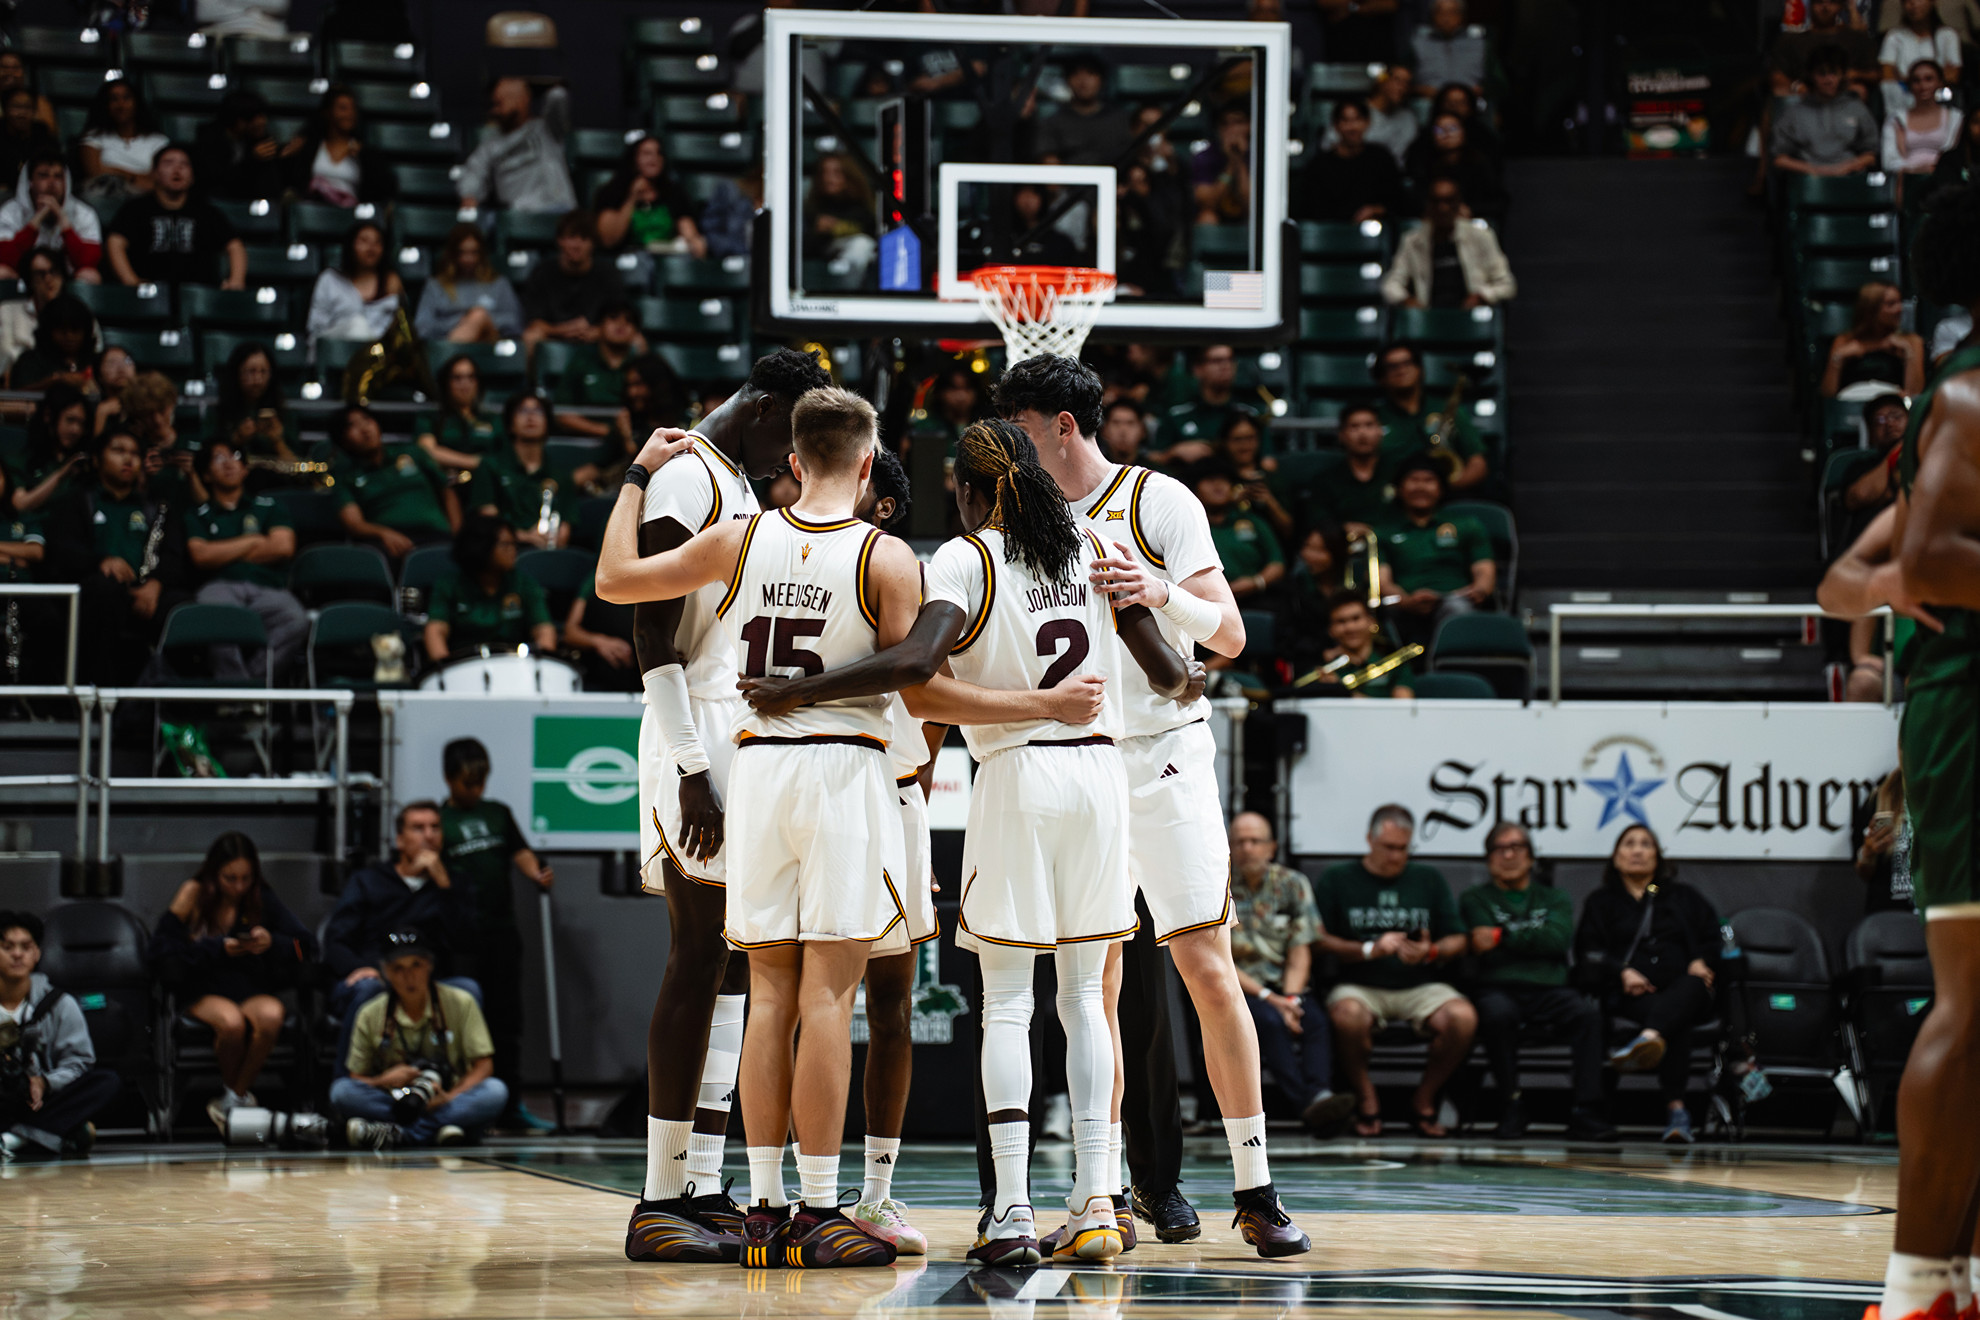
ASU secured an 83–76 road victory over Hawaii in a tightly contested matchup defined by efficient shooting, key defensive moments, and a dominant stretch late in the game. The Sun Devils used a 49-point second half and a series of timely plays to pull away after entering halftime trailing 41–34.
Second-Half Turnaround Fuels ASU Win

ASU flipped the game after the break, hitting 14-of-31 (45%) from the field and attacking the paint effectively. A 7–0 run—ASU’s longest of the night—proved pivotal, helping the Sun Devils wrestle momentum back after Hawaii led for over 27 minutes of game time.
The decisive moment came at 2:00 of the second half, when ASU took its largest lead (83–76) following a Maurice Odum jumper. Hawaii never recovered and failed to score again.
Balanced Scoring Leads the Way for ASU
Arizona State’s strength was its balanced offensive output:
- Bryce Ford (20 pts, 7–11 FG): ASU’s most efficient scorer, attacking the rim and generating 7 trips to the line.
- Maurice Odum (15 pts, 5–14 FG, 6–6 FT): Provided clutch scoring—his late jumper sealed the win.
- Alonzo Johnson (16 pts, 7–9 FG): Highly efficient interior presence, finishing tough shots and anchoring the offense in key stretches.
- Santi Trouet (6 pts, 6 reb) and Neal Meuesen (8 pts) added important rotational contributions.
Despite shooting just 7–19 from deep, ASU compensated with aggressive drives, going 24–37 at the line (65%) and owning a narrow but important 33–33 split on the boards with Hawaii.
Hawaii’s Strong Start Fades Late
Hawaii controlled much of the first half and entered the break shooting a blistering 44.4% from the field and 30.8% from three. But ASU’s defensive adjustments—particularly pressure on ball screens and turnovers—held Hawaii to 35 second-half points.
Standout performers for Hawaii included:
- Isaac Johnson (23 pts, 7 reb, 2 ast): Dynamic offensively, hitting 7–10 from the field and 9–10 from the line.
- G. Nemeiksa (11 pts) knocked down perimeter shots early.
- Dre Bullock (9 pts, 4 ast, 4 reb) provided all-around production.
Ultimately, Hawaii’s 17 turnovers—compared to ASU’s 8—proved costly, resulting in 14 ASU points off turnovers.
Statistical Keys to the Game
Team Comparison Highlights
- FG%: Hawaii 46% | ASU 42%
- 3FG%: ASU 37% (7–19) | Hawaii 26% (6–23)
- FT%: Hawaii 77% | ASU 65%
- Turnovers: ASU 8 | Hawaii 17
- Pts in Paint: Hawaii 38 | ASU 26
- Bench Pts: ASU 32 | Hawaii 19
The turnover differential and ASU’s stronger bench scoring were the ultimate separators despite Hawaii’s efficiency advantages.
Closing the Game: Execution vs. Efficiency
Where Hawaii had the shooting edge, ASU had the situational edge. The Sun Devils were sharper late, committing only four second-half turnovers, while Hawaii gave the ball away seven times in the final half alone. Two late free throws by A. Mukeba and a final defensive stand sealed Arizona State’s win.
Final Thoughts
Arizona State showed resilience, discipline, and depth in a challenging road environment. The balanced scoring attack and second-half defensive intensity highlighted a team capable of adjusting mid-game and finishing strongly.
Hawaii showcased high-level offensive talent but will look back on turnovers and late-game execution as areas to tighten moving forward.


